
A report on the treatment of waste created in a typical Berlin household
This blog is formed from work I undertook as part of an MSc in Environmental Management from the University of Derby from 2016-2019. This website serves as a repository for this work.
The following work was written in 2017
1. Executive Summary
This report covers the issues surrounding the treatment of waste in a typical Berlin- Neukölln household. A 3-week audit of the waste produced in the household was undertaken to help Berlin City Authorities better understand the issues.
The main findings were:
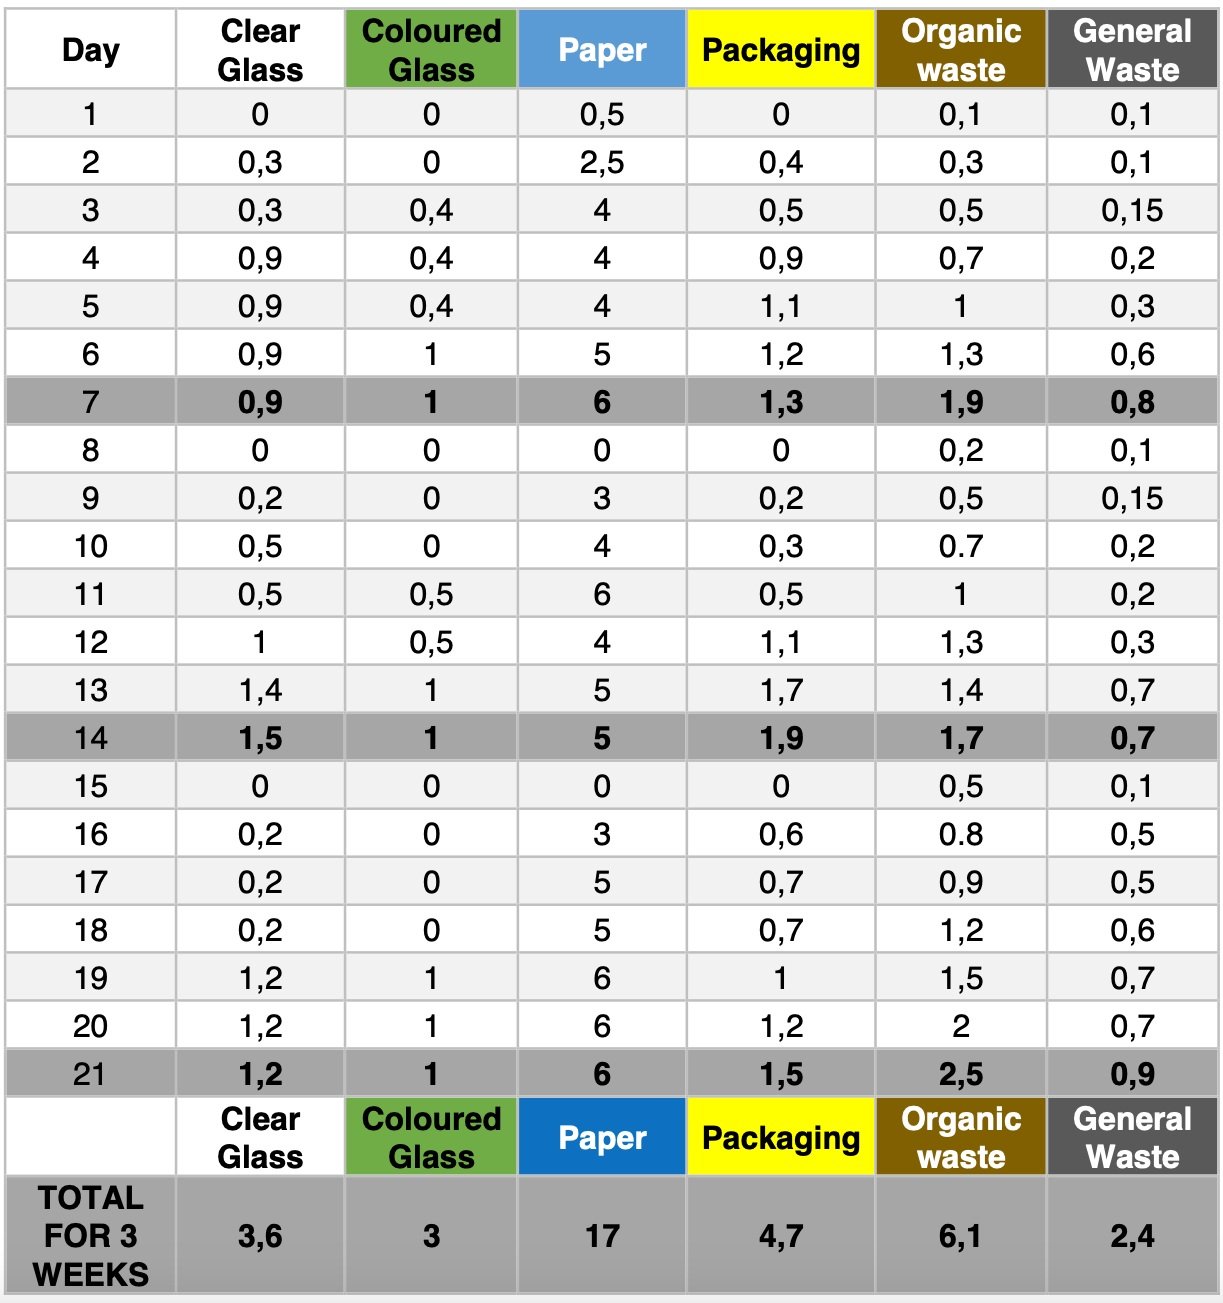
In 3 weeks, the household produced:
3.6kg Clear Glass.
3kg Coloured Glass.
17kg Paper.
4.7kg Packaging.
6.1kg Organic Waste.
2.4kg General Waste.
64.2% of the waste was recycled.
At least 19,3% was sorted, then incinerated.
At least 16.6% was anaerobically digested to produce fuel gas, then composted.
The largest waste stream was paper.
All of the waste was processed within the Berlin area.
This report highlights the main issues as:
20% of waste is wrongly sorted by households.
The efficiency of the waste collection process could be improved, as could the
education of the public.
The Proximity Principle could lead to limited business competition in Berlin.
This report recommends:
Better information on waste sorting for the public.
Berlin needs to attract businesses to the local recycling market, to improve
competition and drive down costs.
A cost-benefit study should be undertaken into the concept of a single waste stream
for Packaging and General Waste.
2. Introduction
This report will, through an audit of a typical Berlin household’s waste, review Berlin City Authority’s (BCA) waste management strategy and will critically review the current waste collection system in Berlin. Consideration will be particularly paid to issues of cost, the Proximity Principle and if the BCA’s waste management strategy meets National targets.
3. Site Description
The site is a 2 room, 60m2 low-rise apartment, typical of the area. There are allotment gardens and a Netto supermarket nearby (see Fig. 1 for location of site within Berlin, see Fig. 2 for detailed map of the area).
The site is situated in the ‘Britz’ neighbourhood of Berlin-Neukölln, with a population of ca. 42,000 (Berlin.de, 2017). Neukölln is traditionally a poorer part of the city, with a large working class and immigrant population (BBC, 2013). The immediate vicinity of the site is a mixture of housing and industrial units.
3.1. Household
The household consists of a married couple, a 54-year-old electrician and a 51- year-old office manager. They prepare breakfast and evening meals together, but both work full time out of the apartment and usually eat a packed-lunch at work. They have two grown children that live elsewhere. They also have a cat.
4. Methodology
The household waste was collected in bins defined by the standard Berlin categories: Clear Glass, Coloured Glass, Paper, Packaging, Organic waste and General waste (See Appendix 1). These bins were already present in the household. At the end of each day, the waste bins were weighed by the household and recorded as a cumulative total to the end of the week, when they were emptied. The household was also given a digital camera to record any issues they encountered with waste disposal.

Fig.1: Map of site location (Red Marker) in south-east Berlin, Germany. Orange squares represent locations of Berlin recycling centres (OpenStreetMap)
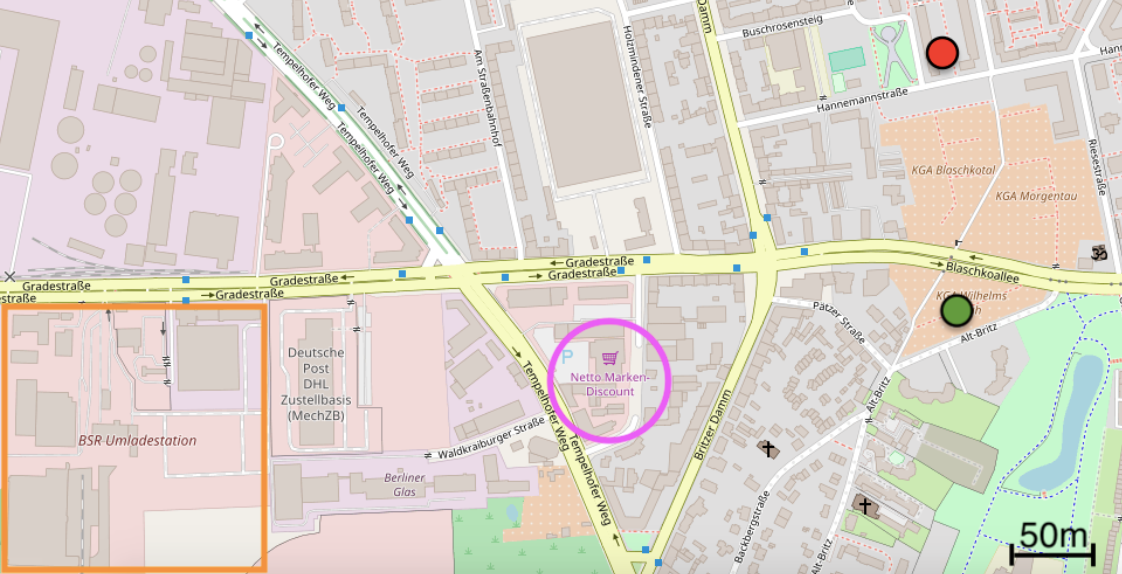
Fig.2: Detail map of site location (Red Marker), with Recycling centre (Orange square), Allotment gardens (Green Marker) and Netto supermarket (Pink circle) (OpenStreetMap)
5. Results
5.1. Waste / Recycling Produced
(See Appendix 2 for Data Table from 3-week study)

Graph 1: Total waste generated during 3-week period by weight * divided as a proportion of the total waste.
5.2. Analysis of Waste / Recycling Produced
5.2.1 Clear Glass
Clear glass made up almost 10% of the total waste by weight. Glass is however relatively heavy and the total number of clear glass containers over the 3-week- period was around 10. These were mostly glass water bottles or jars from marmalade, pickles etc.
5.2.2 Coloured Glass
The coloured glass was mostly beer and wine bottles and totalled around 8. All of the beer bottles were deposit bottles, which will be discussed in a later section.
5.2.3 Paper
Paper made up the largest proportion of the waste by weight. This was mostly made up of newspapers, as the household receives a daily delivery. They also receive a large number of flyers from local supermarkets. Cardboard packaging from online shopping deliveries made up around 40% of the paper waste.
5.2.4 Packaging
A large proportion of the packaging was clear plastic wrappers from supermarket fruit and vegetables. Packing materials from online shopping deliveries also made up a large proportion. The majority of the packaging waste was from sachets of cat food. During week 2 more packaging was produced. This was the birthday week of one of the household, so packaging from gifts increased the total. The couple’s children also came for a family meal, and so more packaged meat, vegetables etc. was purchased.
5.2.5 Organic Waste
This was exclusively made up of fruit and vegetable peelings, as well as coffee grounds and tea leaves. The household composts their waste at their allotment.
5.2.6 Mixed Waste
This was the household’s smallest proportion of waste by weight, though still made up nearly 1kg per week. The household was diligent in their separation of the waste streams.
6. Routes for Waste Disposal
Waste is collected in each household and taken to a communal Waste Collection Area (WCA) in the centre of the apartment block garden (See Fig.3). It is the responsibility of each household to correctly sort their waste according to type.
Weekly collections transport waste to the Neukölln Waste Transfer Site (WTS) marked on Fig. 2 (around 500m from the site).

Fig. 3: The Waste collection area for the apartment block (Ca. 100 households). Weekly bin collections
6.1 Reuse
The German bottle deposit scheme means that all marked bottles can be returned to the shop they were purchased. A small fee is levied per bottle at purchase, which is refunded on return (liveworkgermany, 2017). Currently around 80% of beer bottles are deposit bottles (Welt, 2013), though the trend in recent years has been a move away from the deposit bottle scheme (ZDF, 2017)
6.2 Recycling
Glass is automatically divided by colour and type at the WCA and containerised for sale to local bottle manufacturers. Paper and card is bundled and taken to a processor in Neukölln that pulps the material into lower-grade cardboard (Redmondis, 2015). Packaging waste is, as in the case of steel, aluminium and polystyrene, recycled. Tetrapaks, for example are shredded and pulped to make low grade packing paper (Redmondis, 2015)
6.3 Composting
Organic waste is processed in a facility at Ruhleben, in the west of the city (BSR, 2016a). Here is it anaerobically digested to form ‘biogas’. This is then burned at the neighbouring Vattenfall power station (Tagesspiegel, 2012). After this process, the digestate is taken to a windrow composting site in Schöneich, in the south of the city, where it is composted, along with leaves and garden waste, then sold as fertilizer to farmers (BSR, 2016b)
6.4 Energy from waste
Non-recyclable packaging from the Packaging waste stream, along with the bulk of the General Waste stream, is sent to an Advanced Thermal Treatment (ATT) facility at Ruhleben that incinerates the waste (BSR, 2016c). The heat energy produced is converted into electricity and district heat at the neighbouring Vattenfall power station (Tagesspiegel, 2012).
After incineration, all bottom ash is sorted for recyclables again, with all inert waste either being used as a light aggregate in construction, or taken to landfill (beBerlin, 2013).

Fig. 4 Locations of Waste Processing sites within Berlin area
1: Organic Fermentation Plant Ruhleben, 2: Waste Incineration Plant Ruhleben, 3: Mechanical Physical Stabilisation Plant Reinikendorf, 4: Mechanical Physical Stabilisation Plant Pankow, 5: Soil Washing Plant, 6: Mechanical Treatment Plant Grünau, 7: Transfer Station South, 8: Schöneicher Plan Landfill, 9: Wemsdorf Landfill, 10: Schwanebeck Landfill. Adapted from (Resch, 2013)
7. Discussion & Recommendations
7.1. Key Issues
7.1.1 Cost
Separating the waste before delivery to the WTS, theoretically allows for greater efficiency in sorting the waste at the WTS (Lakhan, 2015). Spiegel (2011) reports however that 20% of waste was wrongly sorted, as demonstrated in Fig. 5. This means Berlin City Cleaning (BSR) must remove this waste from the waste streams.
While little public information exists about the cost of thermal treatment in Berlin, Eunomia (2002) states that the cost, including dealing with the bottom ash is around €133 per tonne. This cost can be offset by the revenue provided by electricity generation.
Cost benefits are found in the case of anaerobic digestion of the organic waste. A Ruhleben style plant would process mixed organic waste for around €100 per tonne (Eunomia, 2002). Berlin has already invested heavily in the current system at Ruhleben, with additional capacity being added in 2012 (WMW, 2012).

Fig. 5: Examples of unsorted recyclable waste in the General Waste bin: 1: Clear glass, 2: Organic waste, 3: Packaging
7.1.2 The Proximity Principle
As seen in Fig. 4 & Appendix 3, the majority of waste processing occurs in the Berlin area. With high efficiency however comes the risk of undersupply for the incinerators. While Berlin is not currently in a state of undersupply, this could lead to waste being imported from neighbouring areas. (Gaube & Weigand, 2006)
In Berlin’s case, the Proximity Principle could stifle competition, as tenders for waste contracts should not be made over state borders. Berlin is a state in itself, meaning that only Berlin companies can run waste schemes (Gaube & Weigand, 2006)
7.1.3 National Targets
Germany’s ambitious target of 65% of waste to be recycled by 2020 was laid down in the Closed-loop Waste Management Act, 2000. This target is above that of the EU Waste Framework Directive 2008 (WFD), which states 50% of all waste to be recycled by 2020 (EU, 2008). Berlin is currently recycling 40% of its waste, while 60% is thermally treated, creating heat and electricity (Berlin.de, 2015).
Confusion amongst the public as to which items belong in the Packaging and General Waste streams has led to the 20% of wrongly separated waste (Spiegel, 2011). In a 2015 survey, 52% of respondents incorrectly identified what should and what shouldn’t be disposed of in the Packaging bin (VZVB, 2015).
7.2. Recommendations
7.2.1 Cost
Efforts should be made to reduce the inefficiency of separating the General Waste. As has been discussed, inaccurate sorting by households still presents a substantial issue. BCA should consider where to address the problem: either investing in the education of the public on compliance with recycling and the correct sorting of waste streams; or in accepting a remaining level of non-compliance/inaccuracy and deciding to respond by replacing the sorting by households with the appropriate waste stream separation technology at the processing plants. Investment in technology that would automatically sort the waste could in the long-run reduce operating costs (Eunomia, 2002).
In principle, this could be applied to the Packaging waste stream too, as it is already a mixed stream. This would create a single stream collection process for all waste, excluding paper, glass and organic waste. There would however be a large financial burden when developing the initial infrastructure, which could, once a cost-benefit- analysis has been carried out, prove to be more expensive than the current system (Eunomia, 2002).
7.2.2 The Proximity Principle
Regarding the Proximity Principle, Berlin is already a good example of local treatment of waste (Gaube & Weigand, 2006). For this trend to continue, Berlin needs to attract businesses to the local recycling market, as well as promote research into new ways to use recycled materials, so that local businesses can use this valuable resource (Gaube & Weigand, 2006).
7.2.3 National Targets
The current waste management system allows for waste to be very effectively separated and reprocessed. Clearer instructions, or a clearer distinction between the Packaging and General Waste streams could help to inform the public and increase the recycling levels in the city.
8. References
BBC, 2013. BBC Travel. [Online]
Available at: http://www.bbc.com/travel/story/20130801-voices-of-neukolln-berlin [Accessed 11 November 2017].
beBerlin, 2013. Municipal waste management in Berlin , Berlin: Berlin Senate Department for Urban Development and the Environment.
Berlin.de, 2015. Abfallbilanz des Landes Berlin 2015. [Online]
Available at: www.berlin.de/senuvk/umwelt/abfall/bilanzen/2015/Abfallbilanz2015.pdf [Accessed 23 November 2017].
Berlin.de, 2017. Einwohnerregisterstatistik. [Online]
Available at: https://www.berlin.de/ba-neukoelln/ueber-den-bezirk/zahlen-und- fakten/statistische-daten/einwohnerzahlen/
[Accessed 6 November 2017].
BSR, 2016a. Biogasanlage. [Online]
Available at: https://www.bsr.de/biogasanlage-22250.php [Accessed 7 November 2017].
BSR, 2016b. Biogut: organischer Abfall mit Mehrfach-Nutzen. [Online] Available at: https://www.bsr.de/bioabfall-20009.php
[Accessed 9 November 2017].
BSR, 2016c. MPS-Anlagen: Restmüll ersetzt fossile Energieträger. [Online] Available at: https://www.bsr.de/mps-anlagen-22307.php
[Accessed 9 November 2017].
BSR, 2016d. Abfälle - richtig trennen, Umwelt schützen. [Online]
Available at: https://www.bsr.de/assets/downloads/broschueren_miniflyer_abfall_2016.pdf [Accessed 25 November 2017].
EU, 2008. Directive 2008/98/EC on waste. [Online] Available at: http://eur-lex.europa.eu/legal- content/EN/TXT/HTML/?uri=CELEX:32008L0098&from=EN [Accessed 30 November 2017].
Eunomia, 2002. Costs for Municipal Waste Managementin the EU - Final Report to Directorate General Environment, European Commission. [Online]
Available at: http://ec.europa.eu/environment/waste/studies/pdf/eucostwaste.pdf [Accessed 22 11 2017].
Gaube, T. & Weigand, J., 2006. Germany’s waste treatment market:Competition will bring fees down. [Online]
Available at: https://www.infraday.tu- berlin.de/fileadmin/fg280/veranstaltungen/infraday/conference_2005/papers_presentations/p aper---gaube_weigand.pdf
[Accessed 23 November 2017].
Lakhan, C., 2015. A Comparison of Single and Multi-Stream Recycling Systems in Ontario, Canada. Resources, Issue 4, pp. 384-397.
liveworkgermany, 2017. How Does The German Pfand System Work, And Is It Effective?. [Online]
Available at: https://liveworkgermany.com/2017/05/how-does-the-german-pfand-system- work-and-is-it-effective/
[Accessed 6 November 2017].
Redmondis, 2015. Bundesweit modernste Papiersortieranlage in Berlin-Neukölln. [Online] Available at: http://www.remondis-aktuell.de/032015/aktuelles/bundesweit-modernste- papiersortieranlage-in-berlin-neukoelln/
[Accessed 4 November 2017].
Resch, M., 2013. Waste Management in Berlin Part One. [Online]
Available at: http://www.atiaiswa.it/wp-content/uploads/2014/10/Berlino1.pdf [Accessed 20 November 2017].
Spiegel, 2011. Is Environmentalism Really Working?. [Online]
Available at: http://www.spiegel.de/international/germany/germany-s-eco-trap-is- environmentalism-really-working-a-751469-2.html
[Accessed 20 November 2017].
Tagesspiegel, 2012. Wie Strom aus Müll gewonnen wird. [Online]
Available at: http://www.tagesspiegel.de/berlin/kraftwerk-ruhleben-wie-strom-aus-muell- gewonnen-wird/6369376.html
[Accessed 18 November 2017].
VZVB, 2015. Ergebnisse der bevölkerungsrepräsentativen Umfrage zum Thema „Wertstofftonne“. [Online]
Available at: /https://www.vzbv.de/sites/default/files/downloads/wertstofftonne-umfrage-vzbv- 2015.pdf
[Accessed 24 November 2017].
Welt, 2013. Pfandschlupf ist das Zauberwort der Einweg-Lobby. [Online]
Available at: https://www.welt.de/wirtschaft/article121424306/Pfandschlupf-ist-das- Zauberwort-der-Einweg-Lobby.html
[Accessed 5 November 2017].
WMW, 2012. Modernised 520,000 TPA Waste to Energy Plant Opened in Berlin. [Online] Available at: https://waste-management-world.com/a/modernised-520-000-tpa-waste-to- energy-plant-opened-in-berlin
[Accessed 23 November 2017].
ZDF, 2017. Der Wahnsinn mit dem Pfandsystem. [Online]
Available at: https://www.zdf.de/dokumentation/planet-e/planet-e-der-wahnsinn-mit-dem- pfandsystem-100.html
[Accessed 5 Novemeber 2017].
Appendices:
Appendix 1: Berlin Categories for Waste Separation
Adapted from (BSR, 2016d)
Glass
What can go in this bin
Bottles, Jars, Glass packaging, medicine and perfume bottles
What cannot go in this bin
Bulbs, Ceramics, Window glass
Paper
What can go in this bin
Newspapers, Magazines, Paper, Card, Paper packaging, Books, Notepaper
What cannot go in this bin
Wallpaper, Dirty paper, Finished paper (waxed, photopaper etc)
Packaging
What can go in this bin
Packaging plastic, Bottles, packaging metals and Tetra Paks Plastics such as old watering cans, toys etc. Polystyrene packaging, lids of drinks bottles, Pots, tools,
What cannot go in this bin
Electronic goods, Lightbulbs, Batteries, Textiles, CDs, Wood, Paper, Glass
Organic Waste
What can go in this bin
Left-over food, Fruit and vegetable peels, Coffee and tea grounds, Egg shells Kitchen paper, Grass and garden clippings, Leaves, Flowers
What cannot go in this bin
Packaging plastic, Bottles, packaging metals and Tetra Paks, hygiene articles, Nappies, Animal bedding, Vacuum cleaner bags, Textiles, Leather, Painted wood, Ashes, Soil, Sand, Gravel, Stones
General Waste
What can go in this bin
Hygiene articles, Nappies, Animal bedding, crockery, Mirror and window glass, Vacuum cleaner bags, House dust Dirty paper, Plastic sheeting, Photos, Carpet, Dried-out paint pots, Ashes
What cannot go in this bin
Packaging plastic, Bottles, packaging metals and Tetra Paks Glass, Paper & card, Food, Electronic goods, Building rubble
Appendix 2: Total waste generated in Kilograms
*Bold numbers are weekly totals, before bins emptied every week
Appendix 3: Example disposal routes of selected waste streams
